- Digital Transformation
- Sep 27, 2026
Loading...


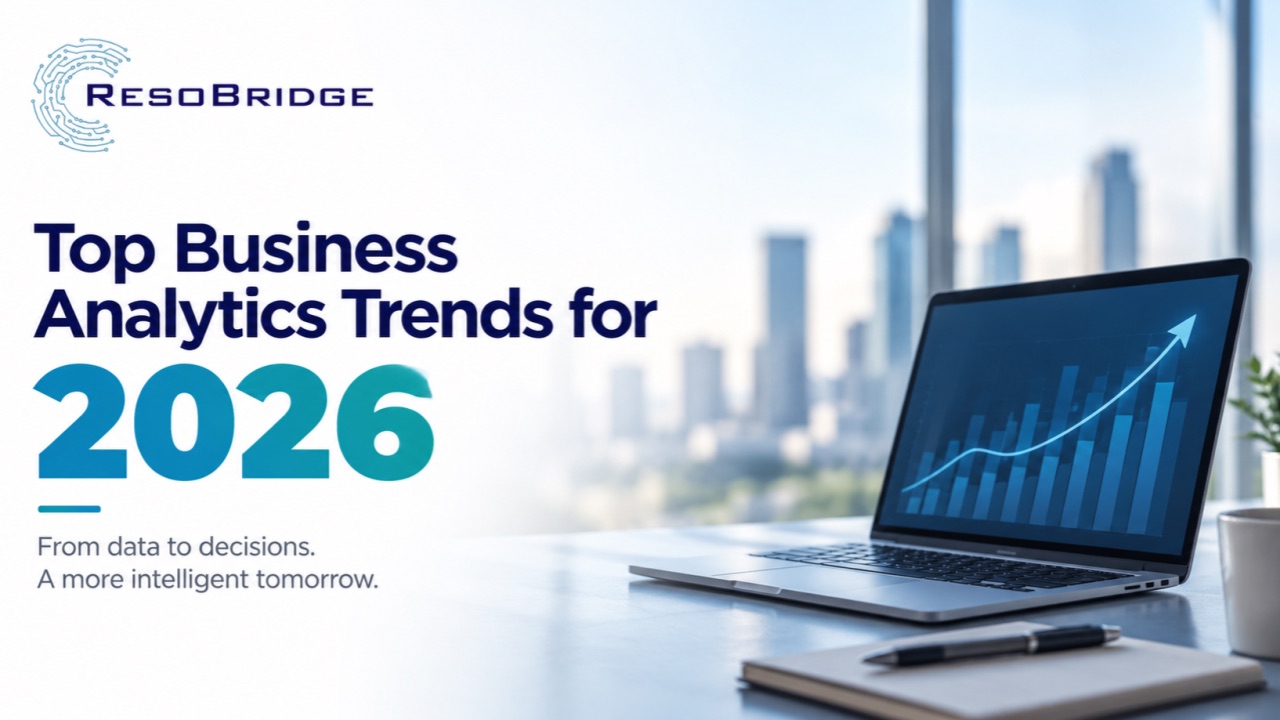
Most companies don't have a data problem anymore - they have a decision problem. They're sitting on dashboards, reports, and dense spreadsheets, yet the same questions keep stalling in meetings: Why did margin slip? Which accounts are about to churn? What happens to revenue if we change price next quarter?
That gap between having data and using it well is exactly what's reshaping business analytics heading into 2026. The shift isn't just "more AI." It's the blending of AI, trustworthy data, business context, and human judgment into decisions that used to rely on gut feel or outdated reports. Gartner's 2026 data and analytics research points to AI-first operating models, stronger semantics, and converged data platforms as the directions enterprise leaders are betting on.
For most B2B organizations, the useful question isn't "what's the newest tool?" It's narrower and more practical: which analytics capability will actually improve a decision we make over and over?
This guide walks through the business analytics trends worth watching in 2026 - including where big data analytics, predictive analytics, and everyday analytics workflows are headed - and what each one means in practical, financial terms.
AI-augmented analytics puts artificial intelligence to work helping people explore data, spot patterns, and generate first-draft insight without waiting on a dedicated analyst. Heading into 2026, the technology is maturing past simple summarization - the direction now is AI that can carry a question from "what happened" through to "here's the evidence, and here's what we'd recommend doing about it."
That said, AI should support judgment, not replace it. The organizations getting this right treat AI as an accelerant for analysis, while governance, data quality, and business context stay squarely in human hands.
Here's what that shift looks like in practice:
Picture a finance team asking why gross margin dropped last quarter. A genuinely useful analytics assistant doesn't just guess - it surfaces the specific products, regions, and cost lines behind the shift, and shows its work. A confident-sounding answer built on the wrong metric is worse than no answer at all, because it's the kind of mistake that doesn't get questioned.
Predictive analytics takes historical and current data and turns it into an estimate of what's coming next. On its own, though, a forecast doesn't do much - its value shows up when it's tied directly to a decision: pricing, hiring, inventory levels, or where to put resources next quarter.
It's worth remembering that predictive analytics isn't the same thing as certainty. Every forecast carries assumptions, a confidence range, and room for error - treating it as a guarantee is where a lot of planning cycles go wrong.
| Business question | Analytics capability | Potential outcome |
|---|---|---|
| What will demand look like next quarter? | Demand forecasting | Sharper capacity and inventory planning |
| Which customers might leave? | Churn prediction | More targeted retention efforts |
| What could revenue look like at different price points? | Scenario modeling | Better-informed pricing decisions |
| Which risks are building? | Risk scoring, anomaly detection | Earlier intervention |
The next stage beyond this is prescriptive analytics - using a prediction to actually weigh options against each other. Say a forecast shows demand could drop 8% next quarter. A scenario model can then estimate how a promotional push or a price adjustment might change that number, turning a warning into an actual plan.
Real-time analytics delivers insight with almost no lag, and it earns its cost when a decision loses value the moment it's delayed - fraud detection, supply-chain disruption, or catching a competitor's move early are good examples.
But real-time isn't automatically the better option. A company that doesn't need second-by-second visibility can often get more value from dependable daily reporting than from an expensive always-on streaming setup that nobody's actually acting on in the moment.
A simple way to decide: reach for real-time analytics only when all four of these are true -
At ResoBridge, our competitive intelligence work is built around exactly this principle - monitoring market signals isn't useful on its own; it only pays off once it's translated into strategic context a team can act on. That's the real value of timely intelligence: not just seeing the event, but understanding what it means for a brand, a portfolio, or a market position.
A semantic layer is a shared, agreed-upon definition for core business terms - revenue, active customer, margin, utilization, forecast accuracy - so every report and every AI tool is working from the same meaning.
This matters more than it used to, now that conversational analytics tools are becoming common. If sales and finance define "active customer" differently, an AI assistant can hand back an answer that's technically correct and still wrong for the business asking the question.
The chain runs like this: a clear business definition leads to a trusted metric, which leads to consistent analysis, which is what actually leads to a better decision. Skip the first step, and everything downstream is shakier than it looks.
Gartner's 2026 data and analytics outlook names semantics as a core piece of where enterprise analytics platforms are heading - not a nice-to-have layered on top.
For finance and executive teams, this means governance needs to stretch beyond who can access what. It should also cover:
A semantic layer rarely gets the same attention as a flashy new AI feature. It's also often the thing quietly responsible for whether that AI feature can be trusted at all.
Data governance covers the policies, roles, and controls that keep data accurate, secure, and properly managed. Heading into 2026, it's less of a compliance checkbox and more of a prerequisite for scaling AI-powered analytics safely. Poor-quality inputs produce bad forecasts, inconsistent KPIs, and recommendations that sound confident but aren't grounded in anything solid. AI speeds up analysis - it doesn't fix what was broken going in.
What solid governance actually looks like:
| Risk | Practical control |
|---|---|
| Incorrect metric | Shared definitions and validation checks |
| Outdated data | Freshness monitoring and alerts |
| AI-generated error | Source checks and human review |
| Sensitive information exposure | Access controls and data minimization |
| Unclear accountability | Named owners for data and decisions |
The financial logic here isn't complicated: stronger governance simply lowers the odds that a real decision gets made on bad information.
Analytics used to sit with a separate reporting team, off to the side of where decisions actually got made. That's changing - it's now showing up directly inside CRM systems, finance platforms, and supply-chain tools, right where the decision happens. Insight is worth more the moment it appears next to the action it's meant to inform, not three days later in a slide deck.
A few examples of what that looks like day to day:
This is the same logic behind ResoBridge's data analytics and intelligence approach - connecting research, engineering, and analytics so insight shows up as decision-ready information, not another isolated report nobody has time to dig through.
Generic analytics tools have their place, but a lot of the real business value comes from context a generic tool doesn't have. A pharmaceutical company and a retailer aren't just measuring different numbers - they need different data sources, different forecasting models, and different definitions of what "success" even looks like.
Industry-specific analytics tends to include:
This shows up clearly in healthcare and life sciences, where big data analytics increasingly powers market research, patient segmentation, forecasting, and competitive tracking - areas where a generic dashboard template simply doesn't hold up.
The real advantage here isn't sharper technology. It's a sharper read on what the numbers actually mean inside a specific business environment.
The analytics professional heading into 2026 needs more than technical chops. The strongest teams are building a mix of:
This doesn't mean turning every employee into a data scientist. It means building a tighter loop between analysts, subject-matter experts, and the leaders actually making the call.
Not every company needs all eight of these at once. A more useful approach is weighing business value, data readiness, decision frequency, and implementation risk before picking a starting point.
| Business need | Best starting point | What to measure |
|---|---|---|
| Inconsistent reporting | Semantic layer and data governance | KPI consistency, reporting time |
| Slow planning cycles | Predictive analytics and scenario modeling | Forecast accuracy, planning speed |
| Missed market changes | Real-time intelligence | Alert relevance, response time |
| Too much manual analysis | AI-augmented analytics | Analyst productivity, error rates |
| Fragmented data | Data engineering and integration | Data freshness, completeness |
| Weak commercial decisions | Industry-specific analytics | Revenue, margin, campaign outcomes |
The best first investment is usually whichever capability fixes a decision problem that's already expensive and already repeating - not whichever technology had the most impressive demo.
ResoBridge is a data-focused analytics consulting firm working across business intelligence, market research, competitive intelligence, forecasting, data science, and data engineering. The approach ties research, engineering, and analytics together rather than treating them as three separate handoffs - which matters, because most analytics projects fail not on the technical build, but on the interpretation gap that follows it.
ResoBridge is a good fit when a company needs to:
Explore the full range of data analytics and intelligence, forecasting, and data science and predictive analytics services, or get in touch to talk through a specific problem.
The best starting point is usually a clearly defined problem - faster forecast turnaround, less manual reporting effort, or making sense of a shift in market performance - rather than a broad ambition to "do more with AI."
AI-augmented analytics, predictive and prescriptive analytics, real-time intelligence, semantic layers, stronger data governance, embedded analytics, and industry-specific solutions built on big data analytics are the trends carrying the most weight this year.
AI is making it faster to query data, spot patterns, and generate first-draft explanations. It doesn't replace the need for reliable data, clear business context, or human review - if anything, those matter more as AI takes on more of the analysis.
They answer different questions. Predictive analytics estimates what's likely to happen next; traditional reporting explains what already happened. Used together, historical performance gives the forecast something real to stand on.
No. It earns its cost when information changes fast and the business can actually act on it in the moment. For a lot of companies, fixing data quality and reporting reliability first delivers more value than a real-time build.
Data literacy, analytical reasoning, business context, AI fluency, and the ability to explain findings clearly to people who aren't analysts. Technical skill still matters - it just isn't enough on its own anymore.
Start with one high-value decision that's currently a pain point, check how ready the underlying data actually is, define the metrics involved clearly, and test the smallest useful version of the capability before scaling it further.
Planning a Power BI rollout, a business intelligence refresh or analytics staff augmentation? We are happy to look at it with you.
Talk to an Expert